Simple Homelab Health Monitoring with Discord Webhooks
2026-02-04
I wanted a (VERY) lightweight way to keep tabs on my homelab server. I didn’t want to ssh to it periodically or a full monitoring stack like Prometheus/Grafana/Netdata. Here’s my solution:
The Setup
Two components make the magic happen:
1. Collector - Runs every hour via cron, appending CPU, memory, load, and disk usage to a CSV file. Data is retained for 7 days (I might have a hoarding issue).
2. Reporter - Runs daily at 9 AM, calculates min/avg/max from the collected samples, checks for journal errors and SSD health, then sends a formatted embed to a Discord webhook. I start work at 9 AM so this is another pleasant addition to the daily ritual email-checking and groaning over a cup of steaming tea.
What Gets Monitored
- CPU usage (min/avg/max over 24h)
- Memory usage (min/avg/max over 24h)
- Load average (min/avg/max over 24h)
- Disk usage (current)
- SSD SMART health status
- System errors from journalctl
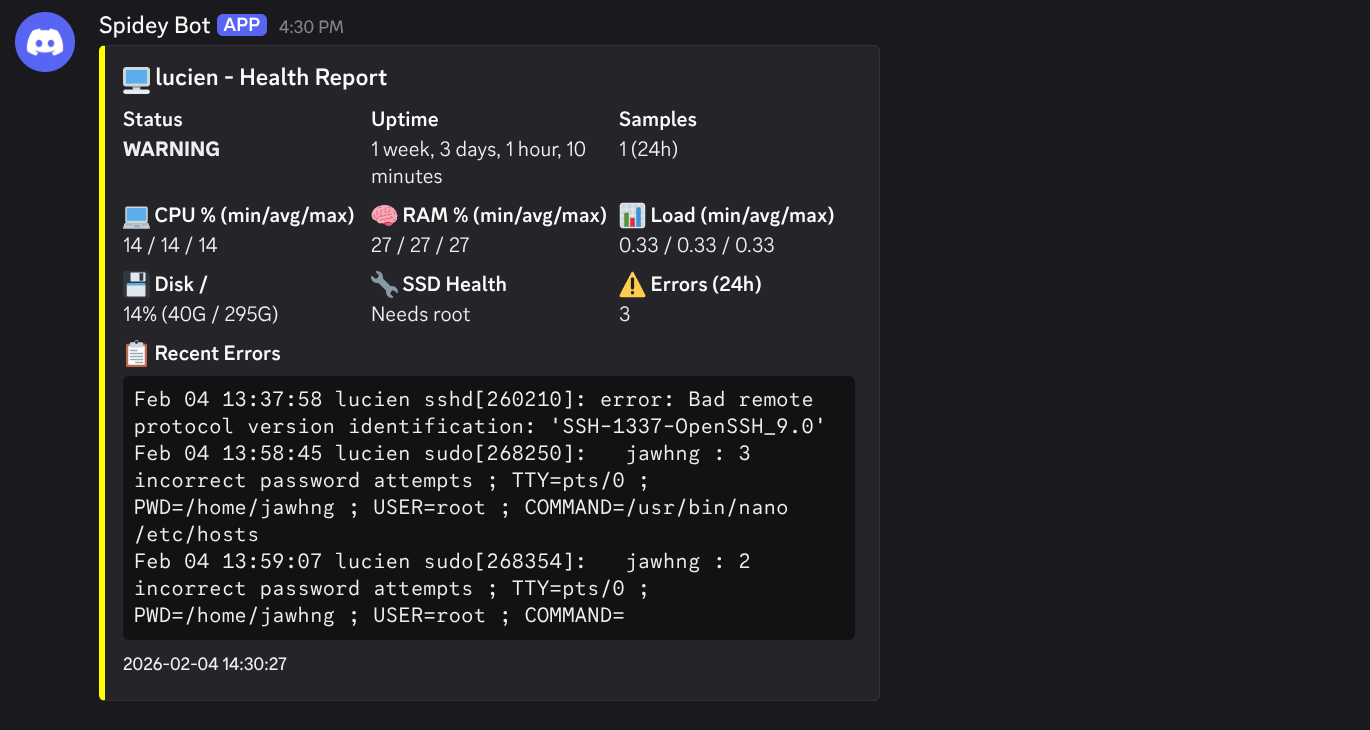
The report color-codes itself: green for OK, yellow for warnings (high usage or errors present), red for critical issues.
Why This Approach?
- No dependencies - Just bash, cron, and curl
- No services to manage - Cron handles scheduling
- Minimal resource usage - A few KB of CSV data per day
- Discord integration - Notifications where I already am
- Actionable - Only alerts on actual issues with
--errors-onlymode
The title image to this post is the actual summary with all the stats at a glance. If there are errors in the journal, they’re included in a code block at the bottom. (The image is a test message from a snapshot which is why it’s got weird values. I will have to come back and update it but I am 100% certain I’ll never do that)
Source
The scripts are available at git.jawhng.xyz/jawhng/homelab-monitoring-webhook.